Cell cycle analysis.
Zero installation.
Browser-Native Cell Cycle Analysis with Local Statistical Processing. Reproducible cell cycle quantification directly from raw .FCS data - executed entirely within your machine's secure boundary.
SybioLab CellCycle
Automated cell cycle phase distribution analysis from .fcs files.
Gaussian curve fitting with a debris model - no data upload, no server-side processing. Your files stay on your machine.
Deterministic Auto-Gating Pipeline
Our deterministic Theil-Sen regression algorithm robustly separates true singlet populations from debris and aggregates. Adjust statistical boundaries dynamically using exposed control parameters (Gate Width, G2 Reach, Debris Cut) and visualize the re-gated data.
Deconvolution & Background Modelling
CytoPeak features three industry-standard mathematical models (Dean-Jett-Fox, Watson Pragmatic, MultiCycle) augmented with advanced debris and aggregate background subtraction to provide highly accurate G1, S, and G2/M phase quantifications and RCS validation.
Deterministic Batch Processing Pipeline
Process entire experimental cohorts. Load dozens of .FCS files at once, let the deterministic auto-gating pipeline analyze them sequentially, and export comprehensive multi-page PDF reports and combined CSV spreadsheets containing all relevant statistics.
21 CFR Part 11 & Cloud Archiving
Designed for rigorous environments. Optionally synchronize your generated reports to a secure cloud dashboard. Every analysis and manual adjustment is tracked in an immutable Audit Trail, complete with electronic signature capabilities for full regulatory compliance.
How it works
No licences, no installation, no system dependencies. Open a browser and start analysing.
Absolute Data Privacy
Security by architecture. Your raw flow cytometry files are never uploaded to an external server for processing. All gating, mathematical fitting, and statistical calculations happen locally on your machine's CPU, ensuring strict compliance with internal data governance policies.
Client-Side WebAssembly
CellCycle is powered by a high-performance Pyodide runtime that executes complex Python data science libraries entirely within your browser. There is no software to install, no licenses to manage, and no dependencies to configure. High-performance local computation on any modern OS.
Inspectable Visualizations
Inspect your data through hardware-accelerated, multidimensional Plotly charts. Manually draw precise polygon gates on scatter plots, explicitly assign G1/G2 peaks directly on the histogram, and continuously verify how manual adjustments impact the mathematical fit and RCS values.
Scientific computing made transparent.
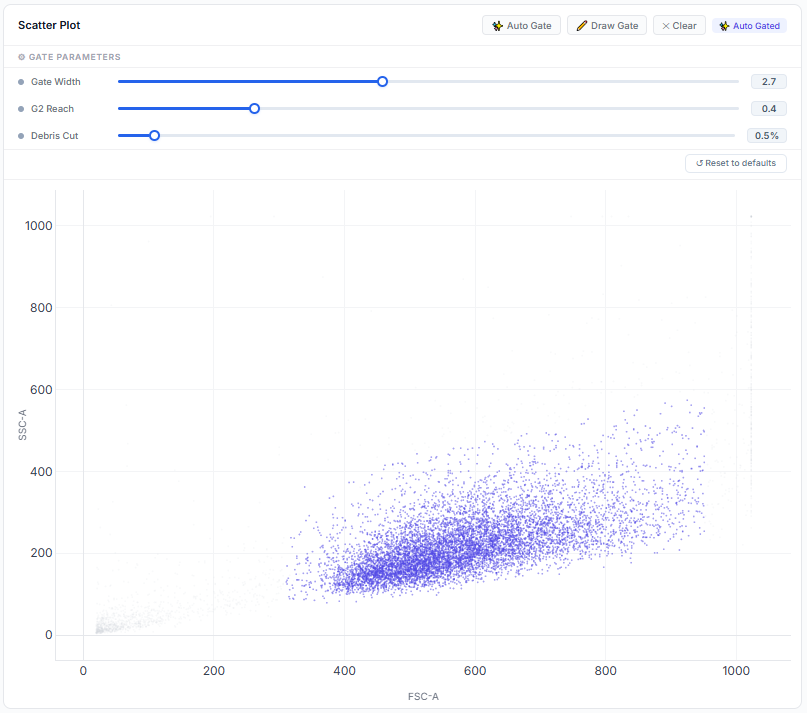
Interactive 2D Topology
Real-time gating parameters overlaying high-resolution density matrices.
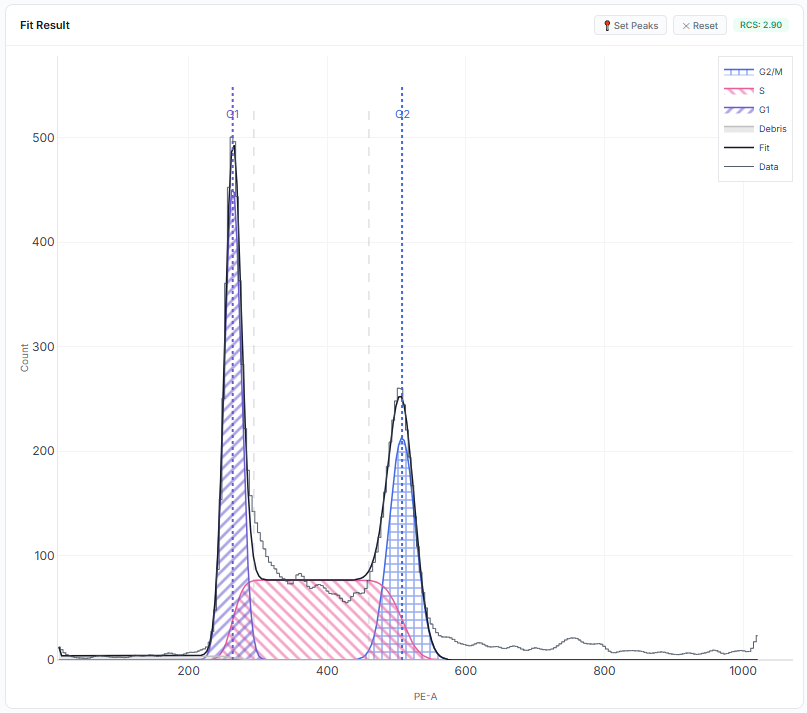
Mathematical Fit Analysis
Multi-Gaussian deconvolution overlaid on empirical DNA content distributions.

Statistical Finalization
Automated quantification of G1/S/G2 populations and fitting quality metrics.
Reproducible Cell Cycle Analysis
Quantify G1, S, G2/M phase distributions directly from your raw .FCS files - zero server upload required.
Try CellCycle Free